
2021-04-26 11:42
Market analysisChainlink price bulls not active at current levels, leaving LINK vulnerable to a 25% decline
Related product:
Forex,Others,Others,Others,Others,Others
Market analysis:
Chainlink price bulls not active at current levels, leaving LINK vulnerable to a 25% decline.
Chainlink price forges descending channel with midline restraining rebounds.
A series of 20% declines in April keeps speculators’ fingers off the buy button.
iTrustCapital, the #1 Crypto IRA platform, announces that LINK is now available on their platform.
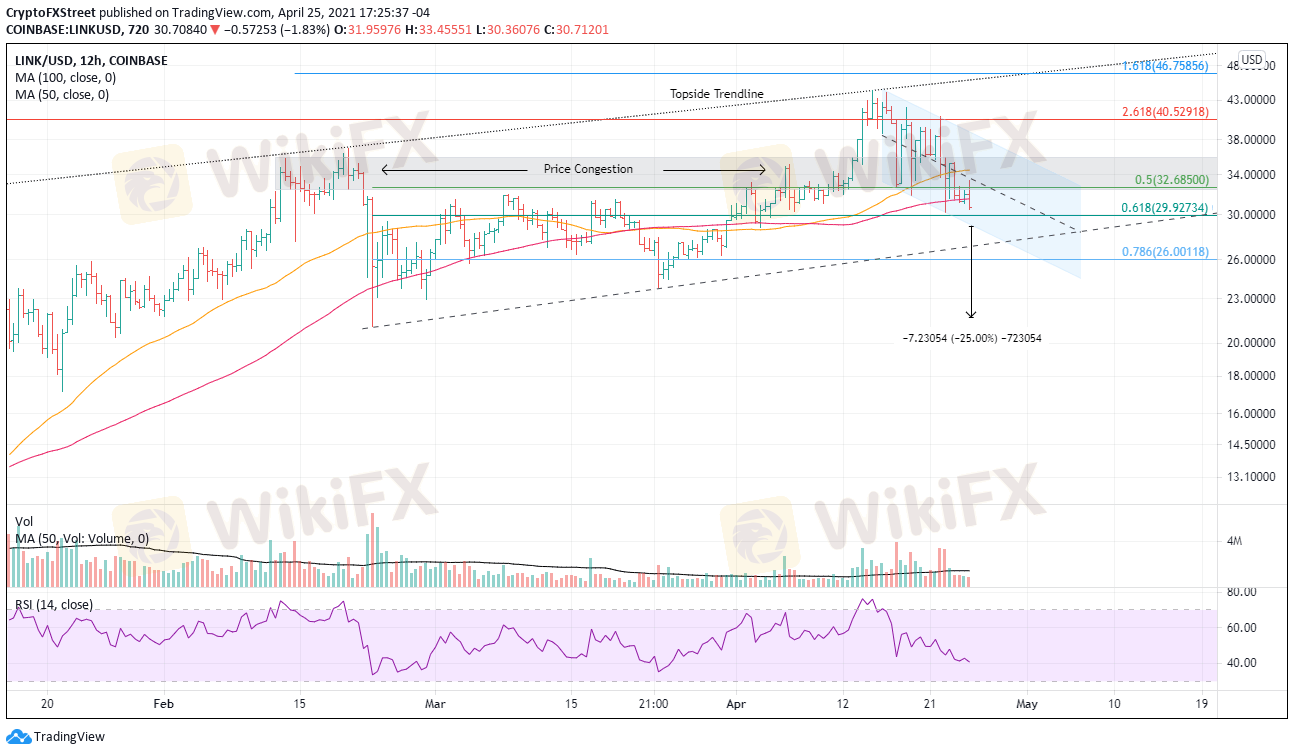
Chainlink price is facing the test of overcoming the momentum of the descending channel and the price congestion between $32.70 and $35.75. A downside trajectory will continue to define the LINK charts in the short term.
Chainlink price looking down for shelter
LINK has been moving at breakneck speed in the cryptocurrency space as the number of projects adopting its oracle grows exponentially. However, the token price has been overwhelmed by the weakness in the broader market, keeping the strong bids on the sidelines.
Despite the selling, LINK does have an impressive range of support between $27.99 and $30.88, according to Intotheblock In/Out of the Money Around Price (IOMAP) data. A total of 46.24k addresses bought 66.48 million LINK. The range extends from just below the lower trend line of the channel to the 100 twelve-hour simple moving average (SMA), suggesting that a significant sell-off from current levels may not occur.
Contrary to the data point above, the charts illustrate a different picture for LINK. Before stalling at the topside trendline at $40.34 in mid-February, the digital token has swung according to the technicals, and that is not likely to change soon.
Note, LINK has crushed support at the 50% retracement of the February decline at $32.68, the 50-day SMA at $31.39, and got within a percent of the 61.8% Fibonacci retracement. The next critical support is the channel’s lower trend line at $28.90. A daily close below the trend line will usher in a test of the rising trend line from the February low at $27.10.
More significant losses could follow, including a test of the March 24 low at $23.75 and lastly, the channel’s measured move target at $21.68, representing a loss of 25% from the channel’s lower trend line.
Like 0

Rey
Trader
Hot content
Industry
Event-A comment a day,Keep rewards worthy up to$27
Industry
Nigeria Event Giveaway-Win₦5000 Mobilephone Credit
Industry
Nigeria Event Giveaway-Win ₦2500 MobilePhoneCredit
Industry
South Africa Event-Come&Win 240ZAR Phone Credit
Industry
Nigeria Event-Discuss Forex&Win2500NGN PhoneCredit
Industry
[Nigeria Event]Discuss&win 2500 Naira Phone Credit
Forum category

Platform

Exhibition

Agent

Recruitment

EA

Industry

Market

Index
Chainlink price bulls not active at current levels, leaving LINK vulnerable to a 25% decline
United Kingdom | 2021-04-26 11:42Chainlink price bulls not active at current levels, leaving LINK vulnerable to a 25% decline.
Chainlink price forges descending channel with midline restraining rebounds.
A series of 20% declines in April keeps speculators’ fingers off the buy button.
iTrustCapital, the #1 Crypto IRA platform, announces that LINK is now available on their platform.
Chainlink price is facing the test of overcoming the momentum of the descending channel and the price congestion between $32.70 and $35.75. A downside trajectory will continue to define the LINK charts in the short term.
Chainlink price looking down for shelter
LINK has been moving at breakneck speed in the cryptocurrency space as the number of projects adopting its oracle grows exponentially. However, the token price has been overwhelmed by the weakness in the broader market, keeping the strong bids on the sidelines.
Despite the selling, LINK does have an impressive range of support between $27.99 and $30.88, according to Intotheblock In/Out of the Money Around Price (IOMAP) data. A total of 46.24k addresses bought 66.48 million LINK. The range extends from just below the lower trend line of the channel to the 100 twelve-hour simple moving average (SMA), suggesting that a significant sell-off from current levels may not occur.
Contrary to the data point above, the charts illustrate a different picture for LINK. Before stalling at the topside trendline at $40.34 in mid-February, the digital token has swung according to the technicals, and that is not likely to change soon.
Note, LINK has crushed support at the 50% retracement of the February decline at $32.68, the 50-day SMA at $31.39, and got within a percent of the 61.8% Fibonacci retracement. The next critical support is the channel’s lower trend line at $28.90. A daily close below the trend line will usher in a test of the rising trend line from the February low at $27.10.
More significant losses could follow, including a test of the March 24 low at $23.75 and lastly, the channel’s measured move target at $21.68, representing a loss of 25% from the channel’s lower trend line.
Forex
Others
Others
Others
Others
Others
Like 0
I want to comment, too
Submit
0Comments

There is no comment yet. Make the first one.
Submit
There is no comment yet. Make the first one.